
数字で見るはるひ呼吸器病院
職員について
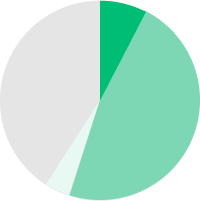
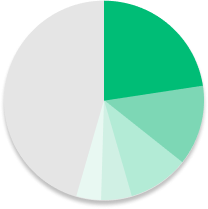
職種別人数割合


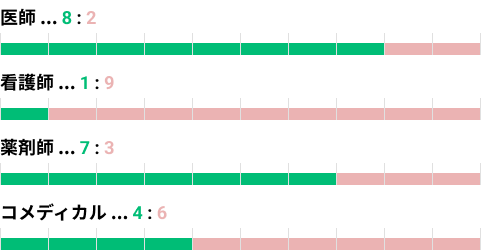
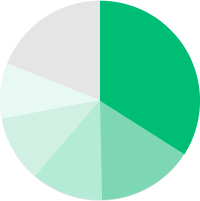
職種別男女比(男: 女)
平均年齢

38.7歳
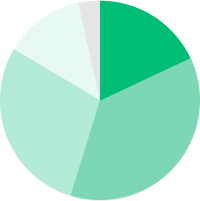
年齢別従業員比率


ワークライフバランス
残業時間平均

9.2時間/月
育休取得率

100%
育休復職率

100%
当院について
呼吸器の台数

29台
在宅酸素の台数

101台
疾患別入院数


※ 2020年4月 - 2021年3月までのデータ
疾患別外来数


※ 2020年4月 - 2021年3月までのデータ
外来患者年齢層
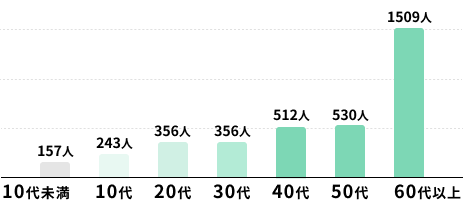
※ 2021年1月のデータ
入院患者年齢層
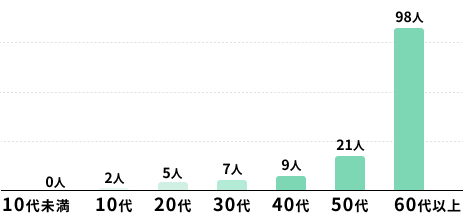
※ 2021年10月のデータ